Fitbit, Zeo, and Weight Graphs for January and February 2013
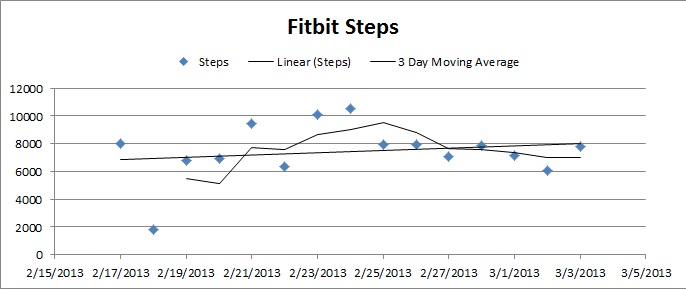
I spent some time graphing some of the numbers I track using moving averages. Here’s an example for my daily Fitbit steps.
The key data point here is the mark on 2/18 though and the real reason I bought the Fitbit – it’s a day I worked from home and failed do to any extra walking.
Here’s a chart of my Zeo Sleep Score (SQ) for 2013:
I find it interesting that my sleep seems to follow these trends alternating between better than average sleep and worse than average sleep.
Finally, weight for 2013:


Wow.. that one day where you work from home really stands out! I was going to say that when I followed myself around with a pedometer.. my weekends tended to be the worst.. in the range of 2-3000 steps, whereas when I worked it’d be 6-8000
Yes it does. I am really interested to see if there is a correlation between this level of sedentary behavior and weight loss.
Unfortunately I already broke the first rule of self experimentation and failed to set a baseline. I expect after the newness of the fitbit wears off, I’ll see a week with 2-3 sedentary days.